Model may perform with excellent accuracy at launch, but six months later its predictions are unreliable. What happened?
Key principle: A model is only as good as the data it sees today, not the data it saw six months ago.
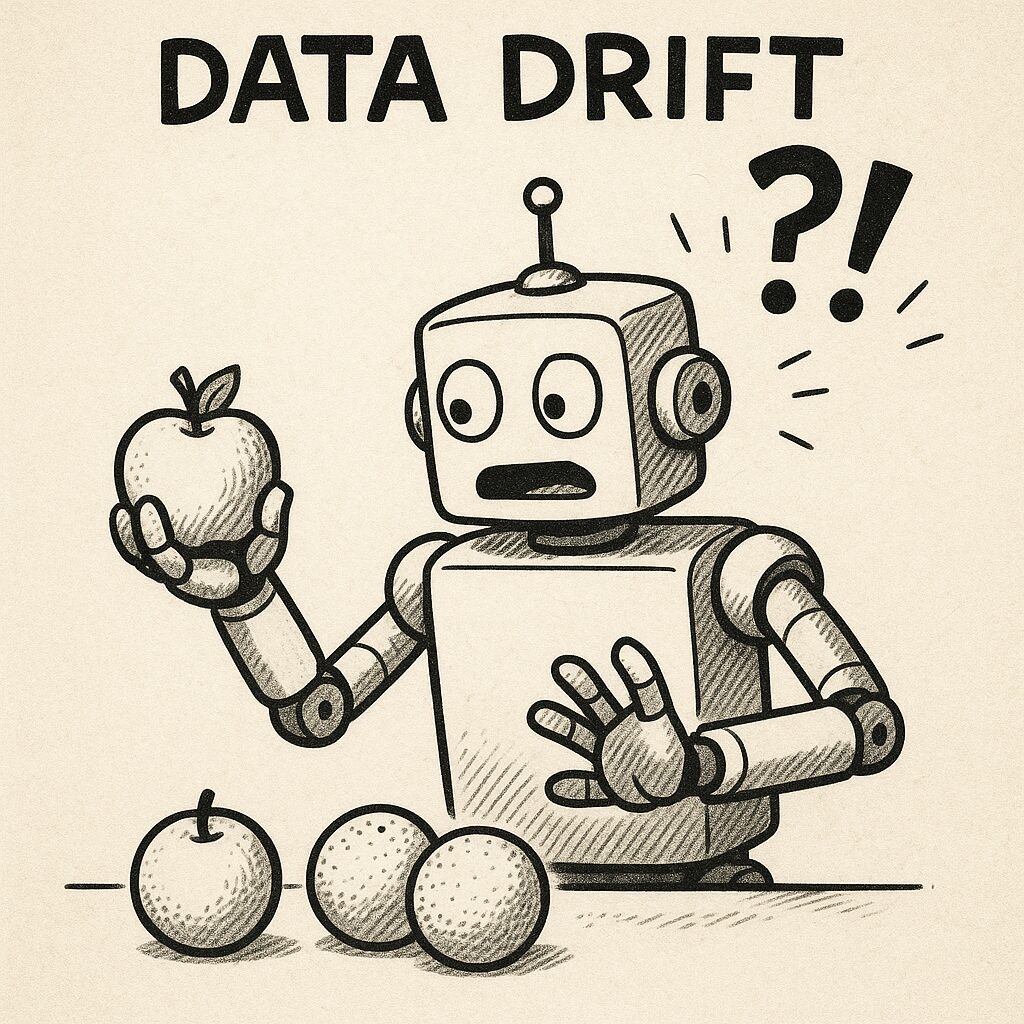
The likely culprit is data drift, a change in the statistical properties of the input data that gradually undermines model’s accuracy. Unlike code bugs or system outages in a instruction driven programming, data drift does not cause immediate failure. Instead, it erodes performance silently, until business decisions are impacted.
Unchecked data drift introduces a risk of biases which can negatively impact business based on the field the model is being used.
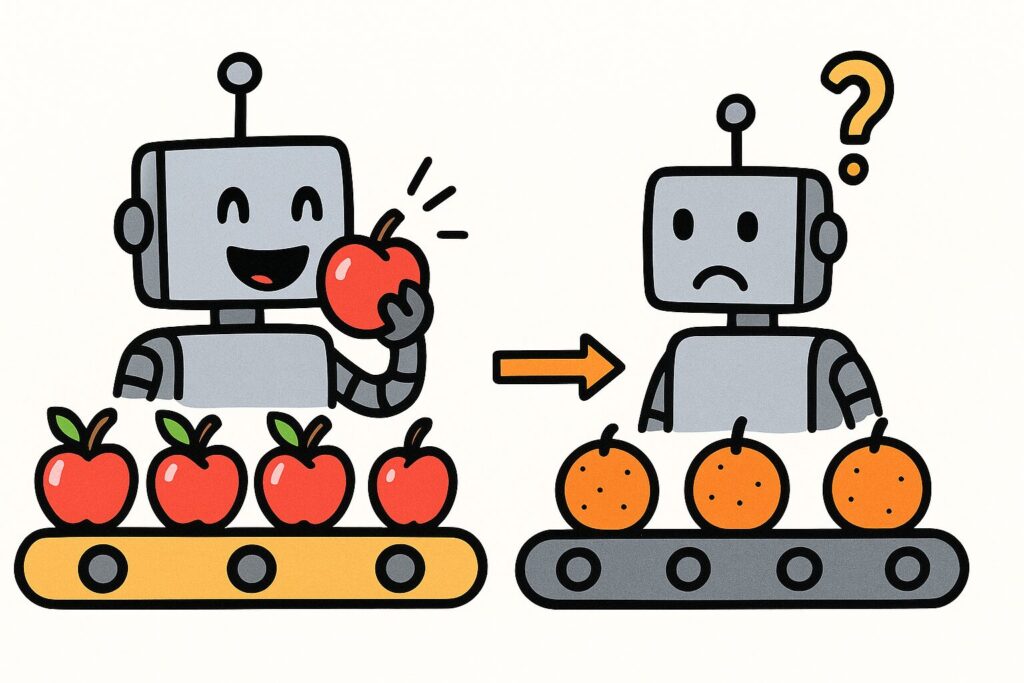
Imagine training a model on clean, consistent apples. Once in production, the data stream gradually shifts, and the model begins receiving oranges instead. To a human observer, both are fruit. To the model, this is a significant distributional change.
Data Drift and Consequences
Data drift occurs when the statistical distribution of input data changes between training and production. This is distinct from concept drift, which refers to a change in the underlying relationship between features and target labels.
The most common types of drift are:
Covariate drift: Input features shift over time. Example: seasonal fluctuations in e-commerce order values.
Prior probability drift: The target class distribution changes. Example: fraudulent transactions rise from 2% to 8%.
Concept drift: The mapping from features to target changes. Example: a healthcare model trained pre-COVID becomes less predictive post-pandemic.
A classifier trained on 60% cat images and 40% dog images may encounter a production stream with 80% dog images. The resulting imbalance reduces model accuracy, despite the algorithm itself being unchanged.
Detecting Data Drift
You cannot improve what you don’t measure. – Peter Drucker
You cannot mitigate what you cannot measure. Drift detection requires systematic monitoring across multiple dimensions.
Statistical Tests – Detecting Drift
There are various statical test that can be performed on the production models to understand the drift.
Kolmogorov–Smirnov (KS) test: Detects shifts in numeric feature distributions.
Chi-square test: Identifies distributional changes in categorical features.
Population Stability Index (PSI): Quantifies deviation in distributions, where PSI > 0.2 typically signals significant drift.
Embedding-Based Monitoring – Detecting Drift
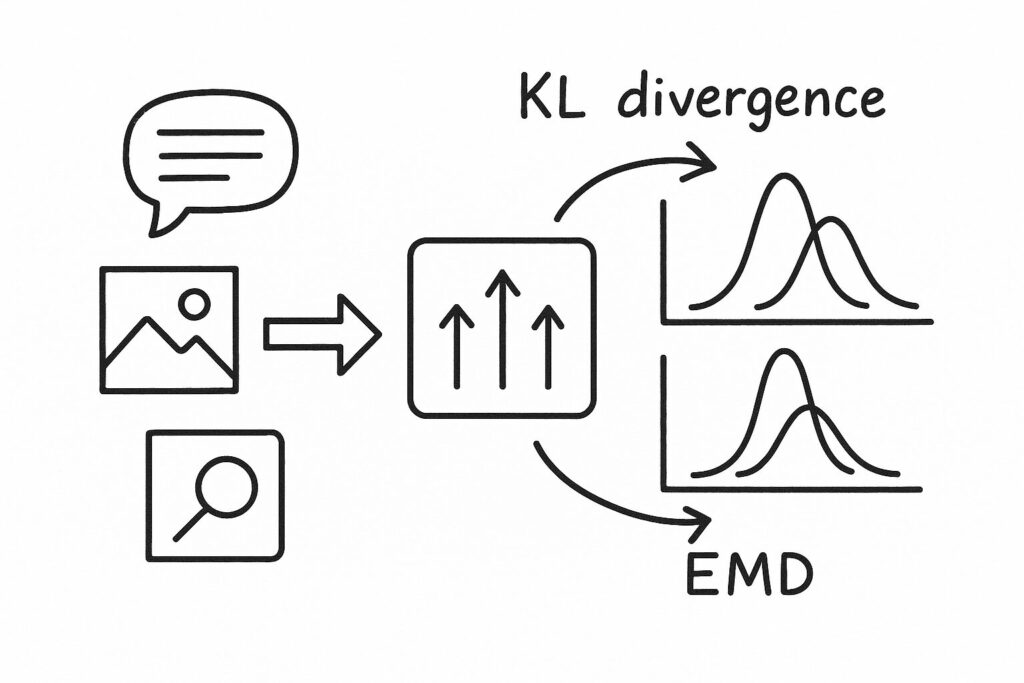

Transform inputs into vector embeddings and compare distributions using KL divergence or Earth Mover’s Distance (EMD). Especially effective in NLP and computer vision applications where raw features are high-dimensional.
In NLP and computer vision, raw inputs (words, sentences, images) are high-dimensional and often sparse:
- Text → represented as tokens, bag-of-words, or long one-hot vectors.
- Images → pixels with thousands of dimensions.
Instead of comparing raw inputs directly, transform them into dense, lower-dimensional vector embeddings (e.g., 256D, 768D) using models like:
- BERT / Sentence Transformers (NLP)
- ResNet / CLIP / Vision Transformers (images)
Embeddings capture semantic similarity — sentences with similar meaning, or visually similar images, end up close together in embedding space.
This involves embedding production data and compare it to training data, that can get us insights into the fact that if there exists a divergence.
KL Divergence (Kullback–Leibler Divergence)
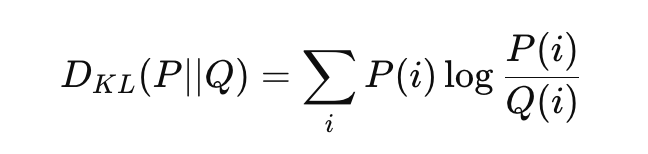
- A measure of how one probability distribution diverges from another.
- If embedding vectors are binned into histograms (or approximate distributions), we can compute
- One caveat with this KL distribution is that the vectors that being compared need to have some kind of semantic overlap, otherwise it blow ups to infinite.
- High KL divergence = drift detected.
Earth Mover’s Distance (EMD) (aka Wasserstein distance)
- Think of distributions as piles of earth.
- EMD = minimum “work” needed to transform one distribution into another.
- More robust than KL because it accounts for distance between bins, not just overlap.
- Works well in continuous embedding spaces (like word embeddings or image features).
Putting into perspective : Real World scenarios
NLP application: If a chatbot was trained on customer support data from 2022, embeddings from 2025 may shift (new slang, product names, or trending issues). Drift detection on embeddings reveals this before accuracy collapses.
Computer Vision: A defect detection model trained on daytime factory images may receive nighttime or low-light images in production. Embedding distributions shift, alerts to retrain model.
Monitoring Metrics – Detecting Drift
- Track descriptive statistics such as mean, variance, and histograms for key features.
- Build drift dashboards using MLflow, Evidently AI, or WhyLabs.1
- Configure alerts when thresholds are exceeded, ensuring early intervention, like any other monitoring and alerting.
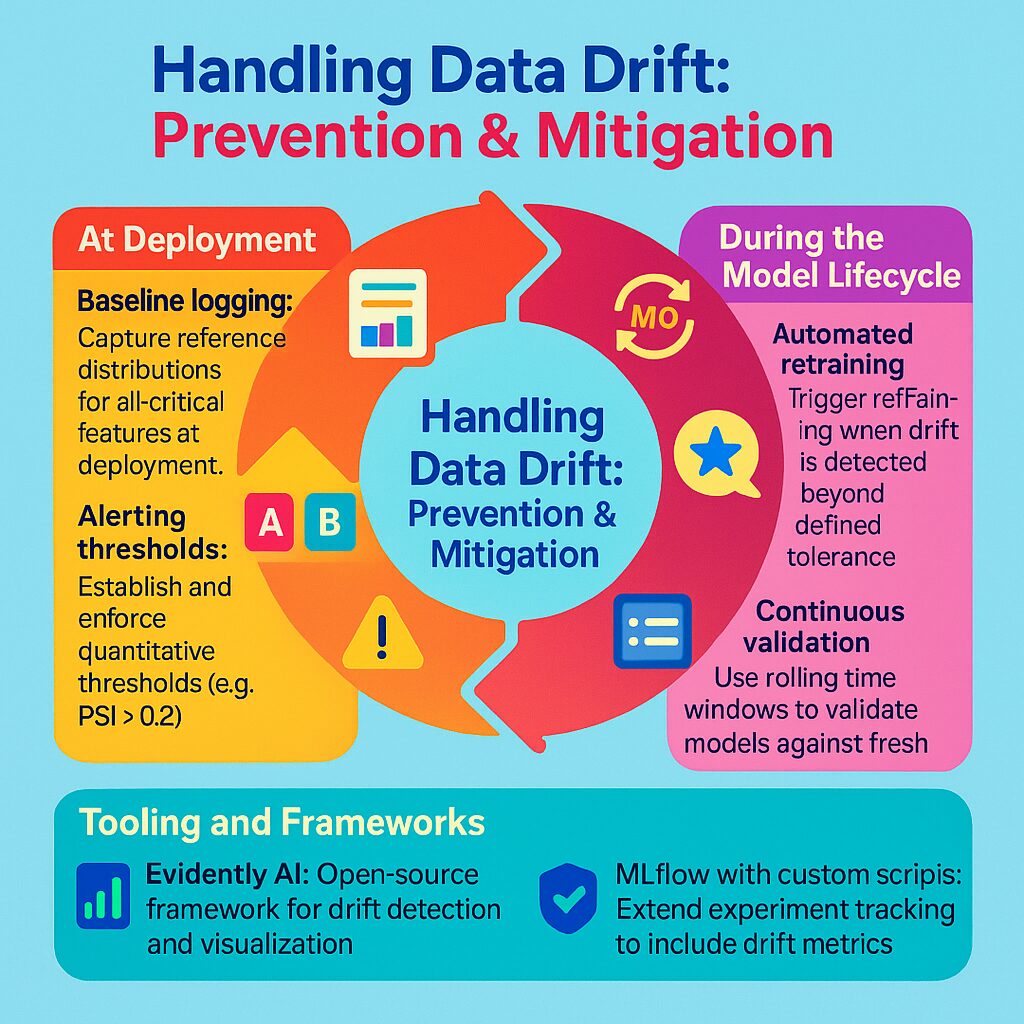
Detecting Data Drift – Prevention and Mitigation
At Deployment
- Baseline logging: Capture reference distributions for all critical features at deployment.
- Shadow deployments: Run candidate models alongside production models to assess drift impact before rollout.
- Alerting thresholds: Establish and enforce quantitative thresholds (e.g., PSI2 > 0.2).
During the Model Lifecycle
- Automated retraining: Trigger retraining when drift is detected beyond defined tolerance.
- Feature refresh: Reassess and update feature relevance periodically.
- Continuous validation: Use rolling time windows to validate models against fresh data.
Best Practices to Stay Ahead
- Integrate monitoring from day one: Drift detection must be part of MLOps design, not an afterthought.
- Version all assets: Maintain strict version control for data, features, and models to support reproducibility.
- Human-in-the-loop validation: Not all statistical drift impacts business outcomes. Domain experts must interpret results.
- Drift-aware CI/CD pipelines: Incorporate drift checks into CI/CD workflows to halt promotion when drift exceeds acceptable thresholds.
Summary
Data drift is one of the most persistent threats to machine learning in production. If left unchecked, it will silently degrade performance until the model no longer delivers value. With systematic monitoring, alerting, and retraining strategies, models remain reliable in dynamic environment.
This article explained the fundamentals of data drift. In the follow-up post, I will walk through steps in how to use MLflow to log drift metrics, visualize distributions, and build a monitoring dashboard.
- MLFlow – An open-source platform for managing the machine learning lifecycle.
Evidently AI – An open-source Python library purpose-built for monitoring data and ML models. It generates rich reports and metrics for: Data drift, Target drift, Data quality, Model performance ↩︎ - PSI – Population Stability Index (PSI) –
It answers: “Has the distribution of this feature changed significantly over time?”
The Population Stability Index (PSI) is a statistical metric used to quantify how much a variable’s distribution has shifted between two datasets.
Usually:
Reference (expected): training data or baseline period.
Actual (observed): production data or a new time period. ↩︎