
In recent years, data has grown exponentially, driving the need for efficient storage, processing, and analysis. This has led to the emergence of diverse architectural paradigms such as data lakes, data lakehouses, data warehouses, data marts, as well as metrics layers and semantic layers, each serving a distinct purpose within the modern data pipeline.
Complementing these architectures are various data modeling methodologies like Kimball and Inmon, along with design patterns such as One Big Table (OBT), wide tables, materialized views, and dbt-managed tables.
In this post, I aim to curate what each of these concepts means and highlight the specific stages of the data pipeline where they play a critical role.
Data Lake
A data lake is a centralized repository that stores raw, unprocessed data in a variety of structured, unstructured, and semi-structured formats at scale. Its like giant dumping ground for data coming format all sources.
- It is the first stop of data journey in the data pipeline.
- Useful for storing and staging data before further transformations.
- There is no strict schema enforcement.
- Schema-on-read: Data is structured at query time rather than write time. Examples : AWS S3, Azure Data lake storage, Hadoop HDFS
Data Warehouse
A structured, centralized repository for storing processed and filtered data, typically used for reporting and analysis. The data is typically modeled using a schema-on-write approach.
It belongs to consumption layer in the data pipeline, where data from lakes or lakehouses are cleaned, transformed and loaded via ETL or ELT patterns into warehouses. Traditionally supports high-performance SQL queries and Business intelligence workloads. Keys traits of data warehouse architecture are
- Schema-on-write : Schema is enforced on write, which means data must conform to schema that is already created.
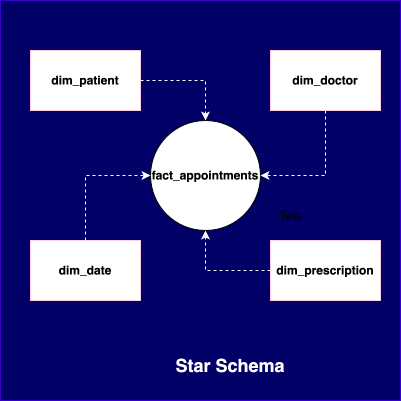
- Most of the times, uses Star schema or Snowflake schema (this is just an extension of star schema – not different one).
Note : When designing data architecture, it’s important to be deliberate about what kind of data ends up in the warehouse. Platforms like Redshift, Snowflake, and BigQuery are built for fast analytics—not for storing large volumes of raw data. Dumping high-volume data like clickstreams or time series directly into the warehouse can quickly drive up costs and isn’t always necessary.
Data Mart
A data mart is basically a smaller, more focused slice of a data warehouse—built to serve the needs of a specific team, department, or use case.
For example, the marketing team might have its own data mart with campaign performance, lead funnels, and customer segmentation, separate from what finance or sales teams use.
Data Lakehouse
A Data Lakehouse is a modern data architecture that combines the best features of both a Data Lake and a Data Warehouse. Simply put
Data Lakehouse = Data lake + Data warehouse
As a Data Lake
- Stores raw data in cheap, scalable object storage (like S3, ADLS, GCS).
- Can handle structured, semi-structured, and unstructured data (e.g., logs, images, videos, JSON).
- Schema-on-read: We can store data without defining a schema upfront.
- Good for data science, ML, and exploratory workloads.
As a Data Warehouse
- Provides SQL-like querying with ACID transactions, indexes, and optimizations.
- Supports schema-on-write when needed.
- Enforces data quality, governance, and security.
- Great for BI and analytics, like dashboards and reporting.
Key Technologies behind Data Lakehouses
The capabilities that lakehouse support are, ACID transactions, Time travel (versioning), schema enforcement and evolution and indexing and caching for performance. Some popular examples of data lakehouse platforms are
- Databricks Lakehouse Platform (Delta Lake)
- Apache Iceberg
- Apache Hudi
- BigQuery with Object Tables
- Amazon Redshift Spectrum(S3+AWS Redshift+Redshift Spectrum extension with Glue catalogue or Redshift catalogue )
The data lakehouse has been gaining popularity due to several key advantages that accelerate data insight generation. Notably, it offers a unified architecture that enables a “store once, use many times” approach. This reduces data duplication, simplifies data pipelines, and supports cost-efficient storage with minimal data movement, a highly appealing architectural trait for modern analytics.
Metrics Layer / Semantics Layer
The metrics layer (or semantic layer) is an abstraction that defines business metrics in a consistent way, ensuring all stakeholders use the same logic and calculations regardless of business intelligence tool. It is source of truth for metrics layer.
The real advantage is that we don’t end up writing different SQL for the same metric across dashboards. The metrics layer helps avoid duplicating logic—define a metric once and reuse it everywhere.
The metric spec depends on metrics platform or framework defines them. For example, if we are using dbt, the metric YAML format is defined by the dbt metric spec.
metric: total_deposits
description: "Total amount deposited in a given period"
type: sum
sql: amount
time_grain: day
filter:
  transaction_type: "deposit"
OBT (One Big Table)
It’s a data modeling approach where we pull everything into one big, flat table with no joins, just all the relevant data in one place. It’s usually done for very specific use cases where we need fast, high-performance analytics.
The most common place we see One Big Table used is in data warehouses and lakehouses, since they’re built for fast SQL queries, and OBTs help skip the hassle of complex joins. On the other hand, it doesn’t really fit well with data lakes, which are more about raw, unstructured data. As a note, OBT share the similar concept of wide tables.
While OBTs have their benefits, they’re not the most storage-efficient. But they keep things simple, which I think matters more, especially when we need fast query results and storage is pretty cheap these days.
Schema-on-Read vs Schema-on-Write
Schema-on-Read
Schema-on-read is a data modeling approach used in systems like data lakes, where raw data is stored as-is, and the schema is applied only when we read/query the data, not when we store it.
Case Study : Storing a user activity logs in JSON (semi-structured) format in a data lake.
{"user": "user1", "action": "login", "timestamp": "2025-05-24T12:00:00Z"}
Just dump the data into delta lake without worrying about structure. Later, when a data analyst wants to query the data like so
SELECT user, action FROM logs WHERE action = 'login'At this point, the query engine (like Spark, Presto, AWS Athena, etc.) interprets the structure of the data on-the-fly based on the query, it “reads” the schema when it’s needed.
Schema-on-Write
Schema-on-Write is a data modeling paradigm used in data warehouses, where data modeling is done before loading data. As part of data modeling, define tables, columns, types, relationships, constraints, etc before data is ingested using dimension modeling methodologies1 Kimball or Inmon.
CREATE TABLE customers (
    customer_id INT,
    name VARCHAR(100),
    email VARCHAR(255),
    signup_date DATE
);

INSERT INTO customers (customer_id, name, email, signup_date)
VALUES (101, 'Alice', '[email protected]', '2025-05-24');

-- This will fail due to wrong type for `customer_id`
INSERT INTO customers (customer_id, name, email, signup_date)
VALUES ('ABC', 'Bob', '[email protected]', '2025-05-24');
Data Modeling Methodologies
Kimball Methodology (Bottom Up – Dimensional Modeling)
Kimball advocates for a bottom-up approach, where data is first structured for business processes into facts and dimensions, usually in Star or Snowflake schemas.
Fact Tables contains measurable metrics, for example sales amount and quantity. Dimension Tables contain descriptive attributes (e.g., product name, region, customer type).
Since the data is nicely organized into facts and dimensions, it usually makes queries faster and more efficient. Plus, it fits really well with lakehouse setups, which are a more modern take on data architecture.
Kimball is more of a bottom-up approach to data warehousing. It starts with building small, focused data marts for specific business areas and then integrates them into a larger data warehouse
Kimball = bottom-up (start small with data marts, then combine)
Inmon Methodology (Top Down – Normalized / Enterprise Modeling)
Inmon suggests a top-down approach, first create a normalized data warehouse (3NF2) that captures the enterprise-wide data in detail, and then derive data marts for analytics.
Inmon is a top-down approach. It begins by creating a centralized, enterprise-wide data warehouse in a normalized form (usually 3NF), and then builds data marts from that warehouse for specific needs.
If we are working with a data lakehouse, Inmon’s approach isn’t always the best fit. Lakehouses are flexible and can handle data in various forms like structured, semi-structured, even unstructured, so the rigid structure of Inmon’s fully normalized, 3NF model can feel like overkill. Inmon is more suited for traditional data warehouses where strong data governance, consistency, and a single source of truth are top priorities.
Inmon = top-down (start with a big warehouse, then create data marts)
Materialized Views
A materialized view is like a pre-computed table that stores the results of a query. Unlike a normal view (which just runs a query every time), a materialized view saves the output to disk and refreshes it either on-demand or on a schedule.
Let’s say we have a SQL query that joins a few large tables and applies some filters. Running that same query over and over can be expensive and slow. Instead, we can create a materialized view, which stores the result of the query on disk. So now, whenever someone queries it, they’re just reading pre-computed results which are much faster and way more efficient.
dbt-Managed Tables
dbt (Data Build Tool) is a tool for managing data transformations using SQL. With dbt, we can create and manage different types of tables: views, ephemeral models, or materialized tables (like full tables or incremental tables).
This is actually pretty cool as dbt automatically handles all the dependencies for you. Just by looking at your SQL queries, it figures out the right order to build everything, managing the whole hierarchy seamlessly.
To read more on it refer to https://docs.getdbt.com/
That’s all for now. Happy reading and see you in the next one!
Terms at a Glance:
- Dimension modeling — It’s a broader data modeling technique designed to make data easy to understand and fast to query, mainly for analytics. It is focused on organizing data into two types of tables — Fact tables (Store measurable, quantitative data. Eg: sales amount, active applications) and dimension tables (Store descriptive attributes related to facts. Eg: product details, time, customer info). ↩︎
- 3NF — A highly normalized model is mainly used to avoid data duplication. One key thing to remember—non-key columns should only depend on the primary key, not on each other. This structure is super common in OLTP systems (like apps handling day-to-day transactions), where data accuracy and minimal redundancy are really important.. ↩︎